
- Home
- News
- Industry insights
-
How to Improve Packaging Line Efficiency: OEE, Changeovers, and Mix-Adjusted Throughput
How to Improve Packaging Line Efficiency: OEE, Changeovers, and Mix-Adjusted Throughput
Packaging line efficiency improves when a plant measures the output that actually reaches the agreed end point in saleable condition, then separates losses caused by availability, speed, quality, changeovers, and product mix. Nameplate speed is only a machine capability. It does not explain blocked conveyors, unstable feeding, repeated micro-stops, slow quality release, or a downstream case packer that limits the entire line. The useful question is therefore not "How fast can this machine run?" but "Which loss prevents this product mix from becoming good finished output?"
PMMI's 2026 industry report describes a market shaped by more SKUs, shorter runs, workforce constraints, tighter capital discipline, and demand for adaptable automation. Those pressures make line-level measurement more important. A line that performs well on one long campaign may lose a large share of its week when frequent product changes, replenishment, inspection holds, and restart work are included.
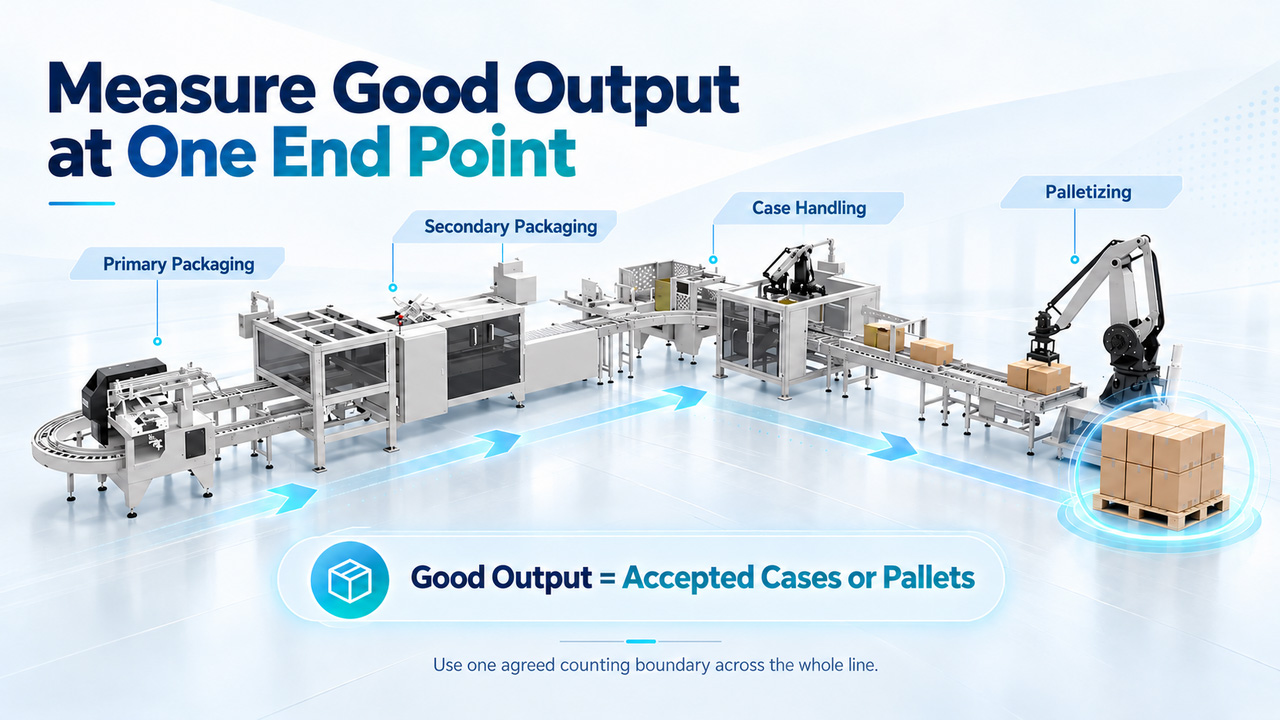
Start with one definition of good output
Efficiency discussions fail quickly when different teams use different end points. The wrapper supplier may count primary packs, the cartoner supplier may count cartons, and operations may care about accepted cases entering the warehouse. All three numbers can be correct while describing different parts of the process.
Define one commercial output point before comparing performance. For a complete line, that point is often an accepted case or pallet, not the first machine discharge. Record the product, pack format, planned production time, good-output definition, and treatment of planned stops. If rework or inspection holds are counted as good output in one report but not another, the metric will not support a fair decision.
A Soontrue complete-line review should therefore begin with the product route and the counting boundary. The purpose is not to impose one universal KPI. It is to make upstream feeding, primary packaging, inspection, secondary packaging, and end-of-line output visible on the same basis.
Use OEE as a loss framework, not a single verdict
OEE can organize three major loss groups: availability, performance, and quality. It becomes useful when the underlying events are defined consistently. A percentage without event definitions can hide more than it reveals.
| Loss view | Packaging-line question | Evidence to collect |
| Availability | When was the line expected to run but unable to produce? | Stop code, duration, affected equipment, restart condition |
| Performance | Why did the line run below the agreed reference rate? | Actual rate by SKU, starvation, blockage, micro-stop frequency |
| Quality | Where did output stop being saleable? | Reject reason, inspection point, rework status, material lot |
OMAC's Packaging Work Group connects PackML-style machine states with more consistent behavior and performance information. That does not mean every project needs identical controls. It does mean that terms such as stopped, idle, held, starved, blocked, and producing should not change meaning from one machine to the next without documentation.
Find the constraint by product, not by average
An overall monthly average can conceal the product that determines line design. A fragile product may limit acceleration at the infeed. A long pack may reduce sealing rate. A promotional carton may create the slowest changeover. A stable high-volume SKU may make the same line look excellent.
Build a simple matrix before making changes:
| SKU or family | Planned volume | Stable good-output rate | Main stop mode | Changeover burden | Downstream constraint |
| Core format | Human input required | Measure on line | Record dominant loss | Record work sequence | Identify actual bottleneck |
| Variant format | Human input required | Measure on line | Record dominant loss | Record work sequence | Identify actual bottleneck |
| Seasonal format | Human input required | Measure on line | Record dominant loss | Record work sequence | Identify actual bottleneck |
The matrix prevents a common mistake: improving the fastest or most visible machine while the weekly schedule remains constrained somewhere else. If a cartoner is blocked because cases arrive inconsistently, increasing wrapper speed can add accumulation and stops rather than useful output.
Treat changeover as production work
Changeover is not only the time spent turning a handwheel or loading a recipe. For a packaging line, it may include staging film and cartons, cleaning, replacing guides or tooling, loading codes, checking inspection settings, approving the first pack, resetting the case pattern, and restoring stable output.
Use clear boundaries: the last accepted unit of the previous run and the first sustained accepted output of the next run. Then separate the work into preparation before stopping, work that requires a stop, quality verification, and ramp-up. This shows whether the loss comes from machine design, material readiness, instructions, approval, or recovery.
Do not force every format toward the same automation level. A frequent change may justify repeatable tooling and recipe control. A rare low-volume format may be better served by a controlled manual step. The engineering goal is a predictable transition, not the largest possible equipment scope.
Micro-stops deserve their own analysis
A line can lose substantial output without recording a long breakdown. Products touch at a transfer, a sensor needs repeated cleaning, cartons arrive skewed, film tracking drifts, or an operator clears a minor fault every few minutes. Each event looks small; together they define the real operating rate.
Collect the top recurring events by frequency and lost time. Observe what happens immediately before and after each event. A stop reported at the wrapper may begin upstream with irregular pitch. A palletizer wait may begin with unstable case discharge. The event location and the root cause are not always the same.
Video review, state histories, reject records, and operator notes can help, provided the team uses them to test a specific hypothesis. More data does not automatically produce a better diagnosis. The best next measurement is the one that distinguishes between two plausible causes.
Balance the line around recovery behavior
Rated capacities should leave room for normal disturbances, but simply oversizing every machine is not a line strategy. The line needs defined responses to starvation, blockage, inspection rejection, material replenishment, and downstream stops.
Buffers can protect short interruptions when the product can wait without damage or loss of orientation. They cannot compensate indefinitely for mismatched capacities or unstable feeding. Ask what happens when a buffer fills, how held products are released, and whether the quality status of those products remains clear.
During a Soontrue line-performance discussion, these recovery scenarios are more useful than a single speed comparison. They expose interface responsibility and help determine where controls, accumulation, or a different operating sequence may be justified.
Build a weekly mix-adjusted view
For high-mix production, compare proposals or improvement options against the same schedule. Include run length, change frequency, expected stable rate, planned cleaning, normal replenishment, quality release, and known constraints. This creates a mix-adjusted view of output.
The model does not need false precision. Its job is to make assumptions visible. If one option depends on very short changeovers, test that assumption with representative formats. If another depends on maintaining a higher rate, test the complete route through the downstream equipment. Record what has been demonstrated and what remains provisional.
Separate chronic losses from special events
One large breakdown attracts attention, but a chronic loss can remove more output over a month. Create two views. The first ranks events by total lost time. The second ranks them by frequency. A high-duration event may need a reliability project; a high-frequency event may point to product presentation, sensor positioning, material behavior, or an operating standard that is not repeatable.
Do not combine unlike events under a broad code such as "machine fault." A blocked discharge, film-end stop, product gap, safety-device trip, and quality hold lead to different actions. At the same time, avoid hundreds of codes that operators cannot use consistently. Start with a practical loss tree, review uncategorized time, and refine only where a clearer category changes the decision.
Use a short observation sheet beside electronic data. Note what the product was doing, the state before the stop, the first corrective action, and whether the event returned after restart. This gives engineers context that a timestamp alone cannot provide.
Connect operations and maintenance without turning every loss into maintenance
Repeated adjustment is often treated as normal operating work even when it reflects wear, looseness, contamination, or poor access. The reverse also happens: maintenance is asked to solve variation created by materials, upstream product condition, or changing quality criteria.
For the main losses, agree on a condition standard. Examples include belt tracking, guide position, sensor cleanliness, blade condition, seal-jaw surface, air pressure, and conveyor transfer alignment. Define what an operator can inspect, what requires a technician, and what evidence should trigger escalation.
Planned maintenance should protect the conditions that support stable output. It should not become a generic checklist disconnected from actual failures. When a chronic event disappears after a specific maintenance action, record that relationship and verify it across more than one production run.
Put an evidence gate before capital spending
Not every efficiency problem needs new equipment. Before approving capital, state the loss, its measured impact, the suspected mechanism, and why the proposed change addresses it. Then define what result would count as improvement.
A useful investment brief compares at least three paths: restore the current process, modify or upgrade a constrained module, and replace or add equipment. Include implementation disruption, training, spares, integration, and validation, not only purchase price. If the data cannot distinguish among those paths, the next action may be a controlled trial rather than an RFQ.
For larger projects, request that suppliers explain their rate assumptions and exclusions. A proposal that shows the product route, disturbance response, and acceptance method is easier to evaluate than one that offers a higher headline number without a test basis.
A practical improvement sequence
- Agree on the saleable-output point and event definitions.
- Segment performance by SKU or product family.
- Rank losses by lost good output, not by anecdotal frustration.
- Observe the product route around the top two or three losses.
- Separate equipment, material, method, staffing, and approval causes.
- Test one change with a baseline and a clear acceptance measure.
- Confirm that the improvement does not move the constraint downstream.
- Update operating instructions and event coding after the result is verified.
Packaging line efficiency is not a campaign to make every machine run faster. It is the disciplined removal of the losses that matter for the planned mix. Plants preparing an improvement project can use a complete-line review to align product flow, machine states, changeover work, and acceptance evidence before investing in new equipment or controls.
FAQ
A1: What is packaging line efficiency?
Packaging line efficiency describes how effectively a line converts planned production time, materials, labor, and equipment capacity into accepted output. The definition should identify where output is counted and how changeovers, rejects, planned stops, and different SKUs are treated.
A2: Is OEE enough to measure packaging line performance?
OEE can organize availability, performance, and quality losses, but one percentage does not explain their causes or show which machine constrains each SKU. Use it with event data, product mix, good-output counts, changeover records, and direct observation of the line.
A3: How do you find the bottleneck in a packaging line?
Observe the line by product and operating condition, looking for repeated blockage, starvation, accumulation growth, speed loss, rejects, and slow recovery. The constraint can move when the SKU, pack format, staffing, or downstream route changes.
A4: Should every machine run at its maximum speed?
No. Running one machine faster may only build excess accumulation or move the loss downstream. The useful target is stable accepted output at the agreed line endpoint, with enough capacity and recovery margin across the planned production mix.
A5:How can changeover improve overall line efficiency?
Measure changeover from the last accepted output of one format to stable accepted output of the next. Separate preparation, physical adjustments, cleaning, material loading, verification, and ramp-up so the team can improve the steps that actually consume production time.
Sources
PMMI, 2026 Packaging Machinery State of the Industry, 14 September 2026.
OMAC Packaging Work Group, accessed 30 September 2026.